We are excited to introduce this new data collection system to help show the benefits of radiant barrier installed in an attic. The system is still under development and information is updated every several days. Our goal is to eventually have all data updated continuously and available online immediately. Hopefully, at some point users will also be able to dynamically create and view custom graphs of the collected data.
Most Recent Data
| Date Time | Outdoor Temp/RH | Attic Temp, No RB | Attic Temp, Under RB |
|---|---|---|---|
| Live data was previously loaded from the temperature logging database. The data collection system monitored three sensors: outdoor temperature/humidity, attic temperature without radiant barrier, and attic temperature under radiant barrier. | |||
Recorded Highs and Lows (April)
| Sensor Location | Value | High | Date Time | Low | Date Time |
|---|---|---|---|---|---|
| Outside | Temperature | Data was recorded from live sensors | |||
| Outside | Humidity | Data was recorded from live sensors | |||
| Attic, No RB | Temperature | Data was recorded from live sensors | |||
| Attic, Under RB | Temperature | Data was recorded from live sensors | |||
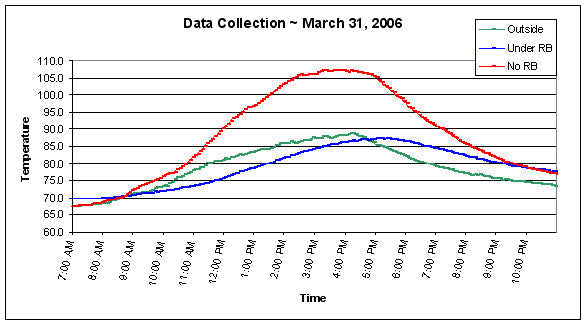
Temperature Graphs
Shown below are several graphs from March.

